This is a neat little problem I ran across today here (Note: the site has a very short answer. Here we overkill it, but try to learn some things by doing so.). The scenario goes like so:
Deciding that his kingdom needed more women, the king proclaimed a new law:
"Henceforth, upon the birth of a son a family shall bear children no more!"
His thought was, of course, that a family could have as many girls as they wanted before having to call it quits, which should raise the ratio of girls.
Did his plan work?
If you want to skip to the solution, click here, and if you want to skip to the final answer, click here. I’m going to take it slow so that we can talk about problem solving methods.
Problem solving
My students may or may not realize it, but I’m always secretly trying to teach them problem solving. Sure, they may be trying to maximize the area of a field using derivatives, or solve some other contrived problem, but I don’t really care about that. What they really should be learning is a way of thinking, an approach that will serve them in all sorts of different settings.
So, let’s solve this thing.
Before solving a problem, especially one that has a “yes” or “no” answer, it’s great to try and guess what the answer should be. That is, let’s get an intuition. Do we think the king’s plan will work?
Maybe. At first pass, the king’s logic seems sensible, at least. Every family has at most 1 boy, but there’s no upper limit to the number of girls (For example, a family could have 3 girls and then a boy). But we should always be skeptical — you didn’t think the problem is that straightforward, did you?
Assumptions
In any problem, we make assumptions. A key to good problem solving is to have the self-awareness to realize what assumptions we’ve already made (probably without realizing it), and to evaluate them.
Here’s some that I made: 1. Boys and girls are born with equal probability. 2. Every family will continue producing babies until they get a boy. (For example, no family will stop with, say, two girls.)
Are these reasonable assumptions to make?
Assumption #1: Boys and girls are born at the same rate
Of course this isn’t true in real life, but it’s close. A good strategy would be to make this simplifying assumption at the moment so that we can arrive at a solution. After doing that, we’ll generalize and allow for probabilities that aren’t 50/50.
Assumption #2: Every family will have babies until a boy is born
Okay, clearly this is not realistic. Does every family have the goal of getting a boy, no matter the costs? Will there be a super-heroic woman that defies the odds and pumps out 312 girls before getting a boy?
Maybe some families only want 1 or 2 children. Or no children at all! However in this latter case, there will be no contribution to any changes in the boy/girl birth rates, so we won’t worry about that.
In fact, we could really go down some rabbit holes here. Do all families consist of one mother and one father? What will the law say if a male child dies? In calculating birth rates, should we be comparing to the previous generation?
It seems clear that we need to keep this problem grounded if we are ever going to have a hope at solving it. So we will assume that, yes, all couples produce babies until a boy is born, and we are then answering the question of if this leads to a higher birth rate in girls.
Solution
At its heart, this is a probability question. We’re going to start out by drawing a probability tree. It’s a good way to visualize what’s going on, and it might give us hints as to where to go from there.
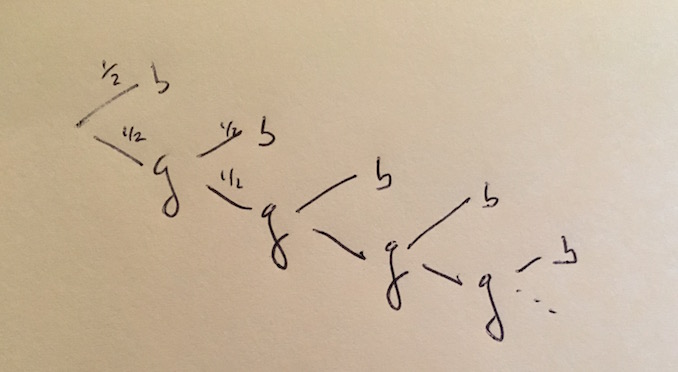
I’ve crudely sketched a probability tree here, with each possible branching having a \(\frac{1}{2}\) chance of occurring.
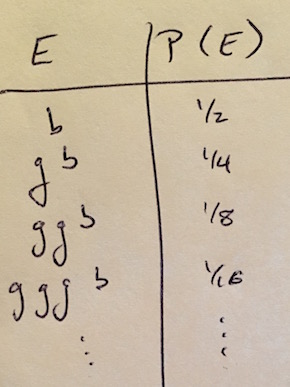
What can we do with this? For one, we can find the probability of any possible outcome by tracing a path from the root of the tree on the left, to a terminal node, or “leaf” on the right. As we do so, we’ll multiply the probabilities that we go through (in this problem, they all happen to be \(\frac{1}{2}\).) Here’s a table of outcomes and their probabilities. (Here \(E\) means an event consisting of a single outcome.)
Wait, what are we trying to solve for here?
We’re being asked, will the King’s plan “raise the ratio of girls”? Let’s be precise about what that means to us — otherwise, our problem-solving efforts will lack direction!
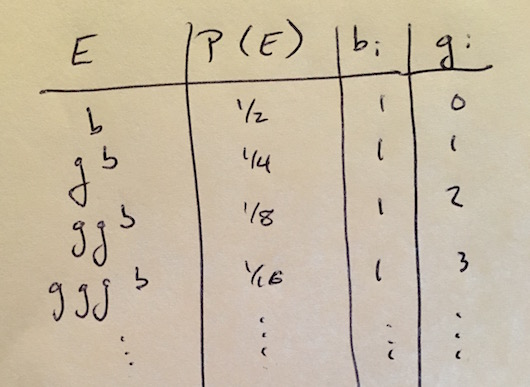
To give us something to work with, let’s define some variables which count the number of girls and the number of boys. These are known as random variables.
Let’s expand that table of outcomes and probabilities to include the values that \(B(x)\) and \(G(x)\) can take on. Note that we refer to these values with the symbols \(b_i\) and \(g_i\).
Expected value
So we have some functions that tell us the number of boys and girls in various situations. What we’d really like to know is, on average, are we going to end up with more boys or more girls?
Why? Well, we can’t predict what a single family might do. But, if we looked at a thousand families, or a million families, we can get a a pretty good idea of what’s going on. To use the technical term, we’re looking at the expected value for our random variables \(B(x)\) and \(G(x)\).
The formula for the expected value for a random variable \(X\) is
Expected value for boys
Let’s calculate the number of boys we expect to have per family, on average. Note that our equation won’t have \(n\) terms, but rather an infinite number of terms. That’s actually not a problem, we simply follow the same pattern.
You may have seen this before. This is a geometric series with ratio of \(r=\frac{1}{2}\), and it has a simple formula.
Ta-dah! We got an answer! On average, we should expect every family to have 1 boy.
…well, we knew that already: every family has exactly one boy, so of course on average there’s 1 boy per family. But this wasn’t a waste of time, think of this as practice for our next section!
Expected value for girls
I saved this calculation for last, both because it’s more interesting and because it gives the answer we’re looking for!
Now this sum is a bit trickier. It’s probably not one you learned how to compute in your calculus class, although you may know how to test to see if it converges (it does). So I’ll give you the answer here, it turns out that:
So the expected number of boys and the expected number of girls are both equal to one!
The answer
Drum roll…
The king’s law will have, on average, no effect on the ratio of girls to boys that are born into his kingdom.
Wait, what? Really? Now this seems pretty counter-intuitive, doesn’t it? Most families will have many girls and only one boy, right?
Except “most” is incorrect here, because 50% of families have a boy and no girls at all, giving the boys an edge on the king’s program.
Futher questions
It’s always a great idea to think about how you can expand upon a problem once you’ve solved the core question. Let’s revisit our question of what happens if the male and female birth rates are different. For this discussion we’ll speed things up, since we covered the basics in a fair amount of detail already.
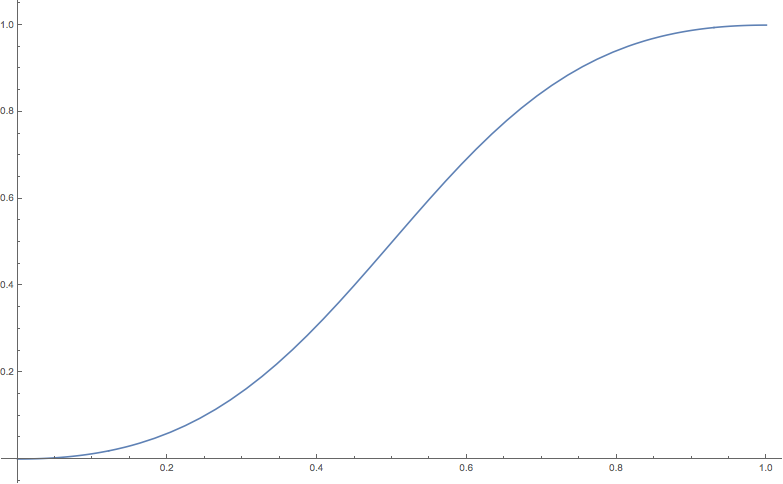
Let \(p\) be the probability that a girl will be born, and \(1-p\) be the probability that a boy is born. So for example, in our original problem, \(p=0.5\) and \(1-p=0.5\).
Then, using the same methods, you can show that
and
Again, if \(p=0.5\) these equations reduce to the values we found before.
Using these formulas, we can calculate the percentage of the new generation that will be female, given a female birth rate of \(p\). The following graph shows this, with \(p\) on the horizontal axis, and the female fraction of the newborn population on the vertical axis.